In this blog post and tutorial, we intend to create a Logic App (in this case, a Logic App Consumption) that sends reports to Log Analytics using an Azure Function to retrieve the data dynamically.
To do this, first, we need to understand a few things. First, what is the Log Analytics Workspace?
📝 One-Minute Brief
Learn how to use a Logic App Consumption to run Log Analytics queries and send dynamic reports. This guide shows how to retrieve data from a Log Analytics Workspace using Azure Functions and automate report delivery.
Log Analytics Workspace
A Log Analytics workspace is a unique environment for logging data from Azure Monitor and other Azure services, such as Microsoft Sentinel and Microsoft Defender for Cloud. Each workspace has its own data repository and configuration, but might combine data from multiple services. It is also a centralized platform for storing, collecting, and analyzing data from various sources.
Think of it as a tool that helps you keep track of everything happening across your Azure environment. It allows you to perform advanced analytics and visualize data in real-time to help you identify and troubleshoot issues quickly. You can also use it to create custom queries and alerts, set up automation tasks, and integrate with other Azure services to get even more insights into your data. Overall, the log analytics workspace is a powerful tool that helps you stay on top of your Azure environment and ensure everything runs smoothly.
As explained above, we can create custom queries to retrieve data from Azure resources, such as Logic Apps, and how does that work?
First, you need to create a Log Analytics Workspace. For that:
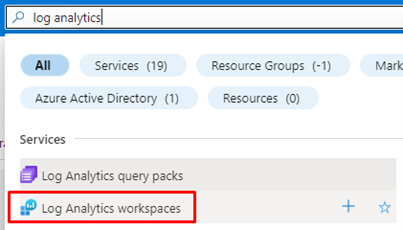
- Search for Log Analytics in the Azure Portal search bar, then click Log Analytics workspaces.
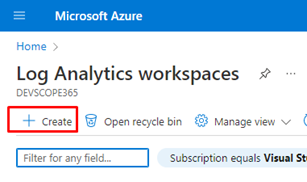
- And next, click on Create.
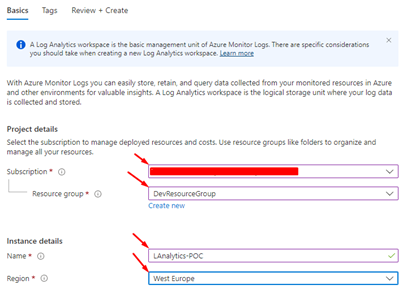
- After this, populate the fields with the more appropriate information for your scenario, like the Name, Resource group, and Region, then click Review and Create.
You should have this once the resource creation is finished, and this is your Log Analytics Workspace.
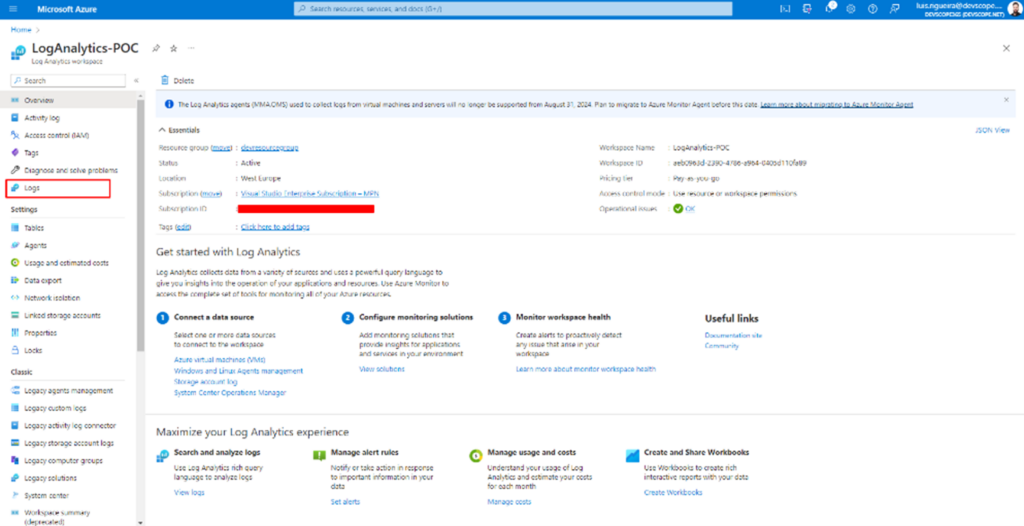
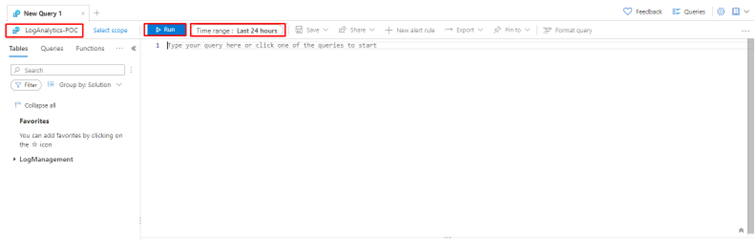
And if you click on Logs, it will open a panel that works via queries.
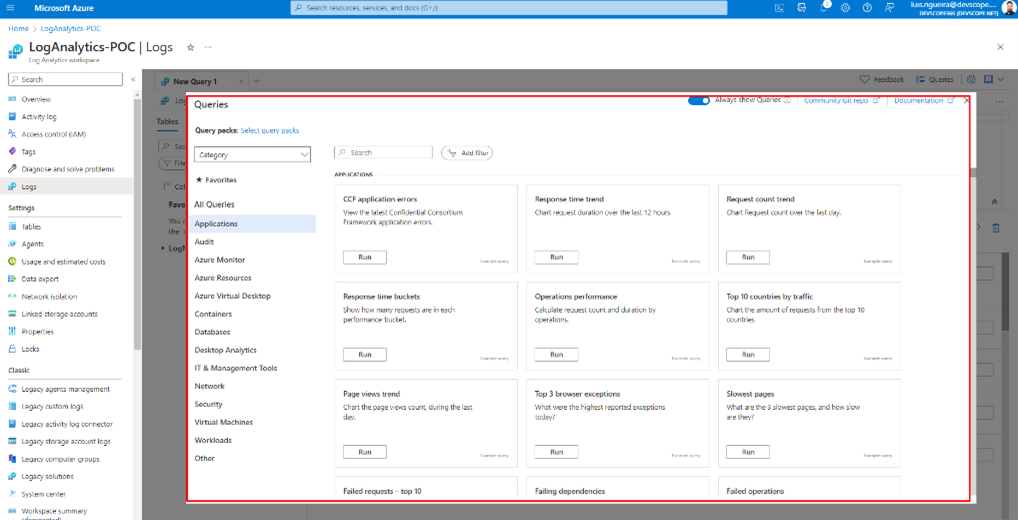
Some of them are already built-in queries, but if you click on the X.
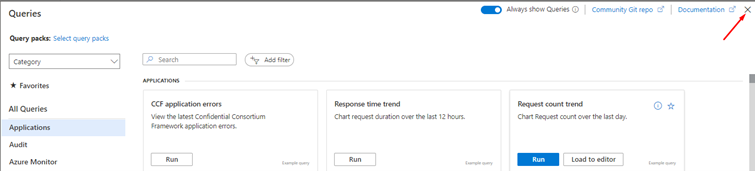
You will have a panel where you can write your own queries. And they work based on a scope. For example, you can apply this query to your resource group, just as you can to your Logic App. You also have a time range to apply the query to events that occurred within the timespan you define.
But about queries on Azure Log Analytics, how do they work? And how to write them?
In Log Analytics on the Azure portal, queries are used to search and analyze data collected in the Log Analytics workspace. Think of queries as a way to ask questions about your data, such as, How many times did this event occur? Or what was the average response time for this API? Once you write a query, the Log Analytics workspace will return the results in a table format, which you can use to gain insights and make data-driven decisions.
To write a query in Log Analytics on the Azure portal, you will use a query language called Kusto Query Language (KQL). And what is Kusto Query Language (KQL)?
Kusto Query Language (KQL) is a query language used in Azure Data Explorer, Azure Monitor, and Log Analytics for querying large datasets. KQL is a simple yet powerful language that lets you to search, analyze, and visualize data in flexible ways. KQL has a SQL-like syntax but also supports many features specific to Azure services, such as functions for querying JSON, time-series, and hierarchical data.
Some of the key features of KQL include:
- Support for querying structured, semi-structured, and unstructured data
- Built-in functions for working with dates, strings, arrays, and other data types
- Support for aggregations, joins, and subqueries
- Ability to query data in real-time
- Integration with Azure services for data collection, storage, and visualization
- KQL is a powerful tool that can help you gain insights and make data-driven decisions, especially when dealing with large datasets in Azure.
Here is an example of KQL:
AzureDiagnostics
| where Category == "LogicAppWorkflowRuntime" and WorkflowName == "my-logic-app"
| where OperationName == "WorkflowRunStarted" or OperationName == "WorkflowRunCompleted"
| project WorkflowName, OperationName, StartTime, EndTime, Status, Message
This query will:
- Search for all events in the AzureDiagnostics table where the Category is LogicAppWorkflowRuntime, and the WorkflowName is my-logic-app.
- It will then filter the results only to include events where the OperationName is either WorkflowRunStarted or WorkflowRunCompleted.
- The project operator is used to select specific columns to include in the results. In this case, the query will return each event’s WorkflowName, OperationName, StartTime, EndTime, Status, and Message.
- | is the pipe operator, which connects the different parts of the query together.
This query can help you monitor the performance and status of your Logic App by tracking when workflows are started and completed, as well as any associated error messages or status codes. You can run this query in Azure Log Analytics or Azure Monitor to gain insights into your logic app’s performance and troubleshoot any issues that arise.
How to configure a Logic App to send data to the Log Analytics workspace
So, now you have an idea of how it works. As we explained before, Azure Log Analytics collects events from various Azure Resources, so to make this possible, we need to create a connection between the Resource we want to collect data from and Azure Log Analytics.
To do that, let’s create a Logic App. In doing so, do not forget to use the same Resource Group and Region where your Azure Log Analytics is stored, give the Logic App a name that makes sense to you, and implement the desired business logic.
Do not forget: Start using Proper names from day one!

Or access to an existing Logic App.
- Next, click Diagnostic Settings, then click + Add diagnostic setting in your Logic App.
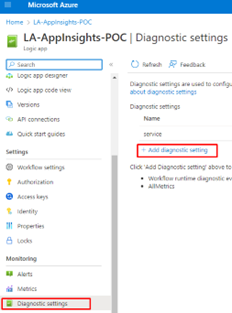
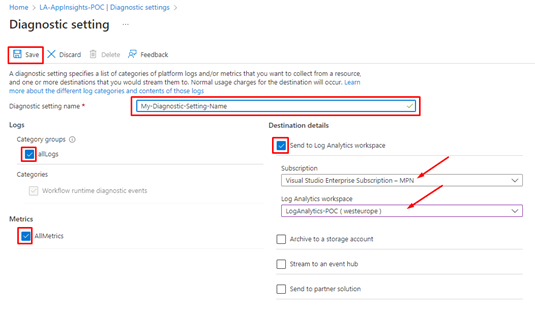
- Give a name to your Diagnostic setting name, and check the boxes:
- allLogs
- AllMetrics
- and Send to Log Analytics Workspace
- Next, choose the subscription where your Log Analytics Workspace is created and choose your Log Analytics Workspace, the one we just created.
And from now on, this Logic App will send data to the Log Analytics!
Create a Logic App to create a report from the Log Analytics Workspace
To do that, we need to:
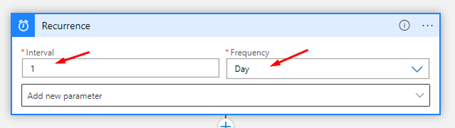
- Create a new Logic App and add a Recurrence trigger and set the following configurations:
- Choose the Interval as 1 and the Frequency as Day.
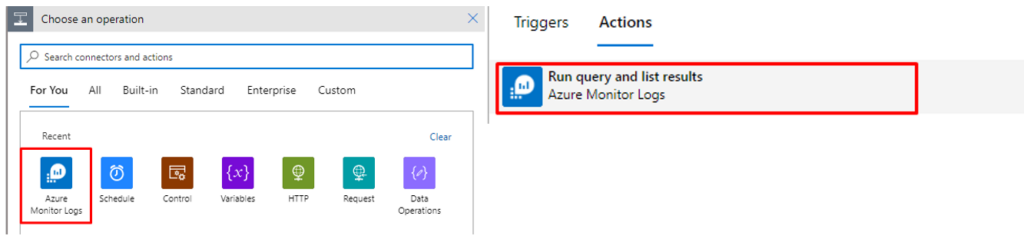
- Next, choose the operation Azure Monitor Logs and the Action – Run query and list results.
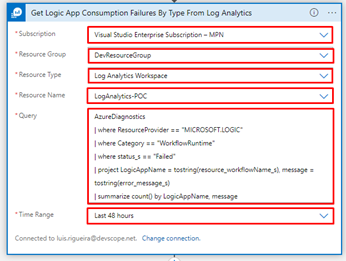
- Next, you will have some fields to populate, like:
- Subscription
- Resource Group
- Resource Type
- Resource Name
- Query
- Time Range
- This is the query we will be using:
AzureDiagnostics
| where ResourceProvider == "MICROSOFT.LOGIC"
| where Category == "WorkflowRuntime"
| where status_s == "Failed"
| project LogicAppName = tostring(resource_workflowName_s), message = tostring(error_message_s)
| summarize count() by LogicAppName, message
In our case, we are dealing with a Logic App that has already returned some errors.
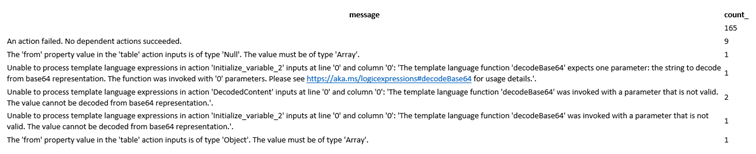
This is the raw output from the query if we run our Logic App:
{
	"statusCode": 200,
	"headers": {
		"Pragma": "no-cache",
		"Transfer-Encoding": "chunked",
		"Vary": "Accept-Encoding",
		"Cache-Control": "no-store, no-cache",
		"Set-Cookie": "ARRAffinity=eac69d9633b62a80172d43feba694263b4d9fccb8b9d953b364b8fc058f6e946;Path=/;HttpOnly;Secure;Domain=azuremonitorlogs-we.azconn-we-002.p.azurewebsites.net,ARRAffinitySameSite=eac69d9633b62a80172d43feba694263b4d9fccb8b9d953b364b8fc058f6e946;Path=/;HttpOnly;SameSite=None;Secure;Domain=azuremonitorlogs-we.azconn-we-002.p.azurewebsites.net",
		"x-ms-request-id": "e8945bb2-f438-4ee9-9b22-58ae9971e462",
		"Strict-Transport-Security": "max-age=31536000; includeSubDomains",
		"X-Content-Type-Options": "nosniff",
		"X-Frame-Options": "DENY",
		"Timing-Allow-Origin": "*",
		"x-ms-apihub-cached-response": "false",
		"x-ms-apihub-obo": "false",
		"Date": "Mon, 13 Mar 2023 12:47:12 GMT",
		"Content-Type": "application/json; charset=utf-8",
		"Expires": "-1",
		"Content-Length": "2536"
	},
	"body": {
		"value": [
			{
				"LogicAppName": "LA-AppInsights-POC",
				"message": "",
				"count_": 8
			},
			{
				"LogicAppName": "LA-AppInsights-POC",
				"message": "An action failed. No dependent actions succeeded.",
				"count_": 17
			},
			{
				"LogicAppName": "LA-AppInsights-POC",
				"message": "The execution of template action 'For_each' failed: the result of the evaluation of 'foreach' expression '@{body('Get_Logic_App_Consumption_Failures_By_Type_From_Log_Analytics')?['value']} ------@{items('For_each_2')}---@{items('For_each_2')?['count_']}---@{items('For_each_2')?['message']}' is of type 'String'. The result must be a valid array.",
				"count_": 7
			},
			{
				"LogicAppName": "LA-AppInsights-POC",
				"message": "Unable to process template language expressions in action 'DecodedContent' inputs at line '0' and column '0': 'The template language function 'decodeBase64' was invoked with a parameter that is not valid. The value cannot be decoded from base64 representation.'.",
				"count_": 2
			},
			{
				"LogicAppName": "LA-AppInsights-POC",
				"message": "The 'from' property value in the 'table' action inputs is of type 'Object'. The value must be of type 'Array'.",
				"count_": 1
			},
			{
				"LogicAppName": "LA-AppInsights-POC",
				"message": "The provided 'Http' action inputs are not valid. A request body must not be included for 'GET' requests.",
				"count_": 1
			},
			{
				"LogicAppName": "LA-AppInsights-POC",
				"message": "Unable to process template language expressions in action 'Initialize_variable_2' inputs at line '0' and column '0': 'The template language function 'decodeBase64' expects one parameter: the string to decode from base64 representation. The function was invoked with '0' parameters. Please see https://aka.ms/logicexpressions#decodeBase64 for usage details.'.",
				"count_": 1
			},
			{
				"LogicAppName": "LA-AppInsights-POC",
				"message": "Unable to process template language expressions in action 'Initialize_variable_2' inputs at line '0' and column '0': 'The template language function 'decodeBase64' was invoked with a parameter that is not valid. The value cannot be decoded from base64 representation.'.",
				"count_": 1
			},
			{
				"LogicAppName": "LA-AppInsights-POC",
				"message": "The 'from' property value in the 'table' action inputs is of type 'String'. The value must be of type 'Array'.",
				"count_": 1
			},
			{
				"LogicAppName": "LA-Monitoring-Telemetry",
				"message": "",
				"count_": 2
			},
			{
				"LogicAppName": "LA-Monitoring-Telemetry",
				"message": "An action failed. No dependent actions succeeded.",
				"count_": 3
			},
			{
				"LogicAppName": "LA-Monitoring-Telemetry",
				"message": "The 'from' property value in the 'table' action inputs is of type 'Null'. The value must be of type 'Array'.",
				"count_": 1
			}
		]
	}
}
If we use this same query in our Log Analytics Workspace, we get these results:
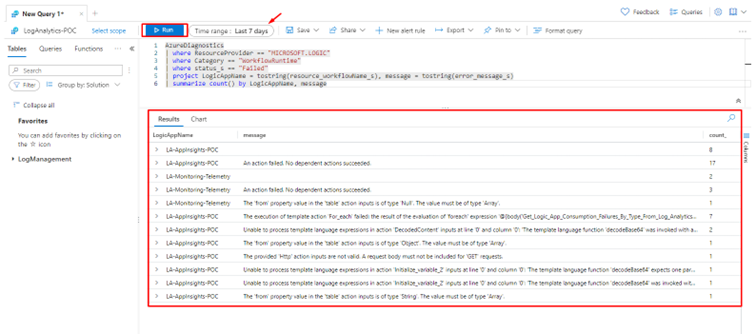
As you can see, we have a report of the Last 7 days with data including the Logic App Name, the error message, and the count.
This is useful in situations where you or your company or the project you are working on is dealing with a lot of data, and you need to know what failed, where it failed, and how many times it failed. Since we can query this information in the Log Analytics Workspace, we can do the same in our Logic App, as we explained before, using Azure Monitor Logs and the Action – Run query and list results.
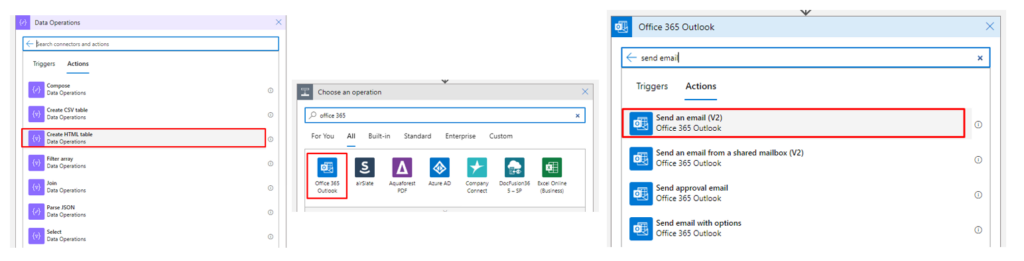
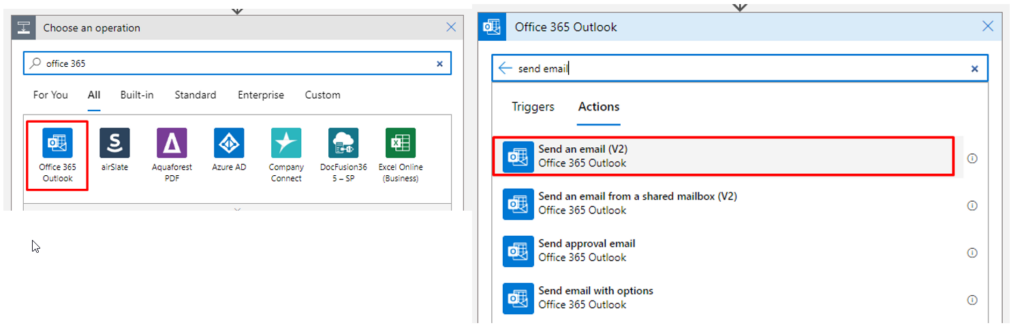
Now going back to our Logic app, we have two options: send this report as an HTML table, using a Data Operation – Create HTML Table, and then send an email with this information.
And what you will receive is something like this (in this example, we are not counting on the Logic App Name)
But this data delivery seems a bit old-fashioned, so why not create something more appealing? Something to be presented in the Body of an email like this:
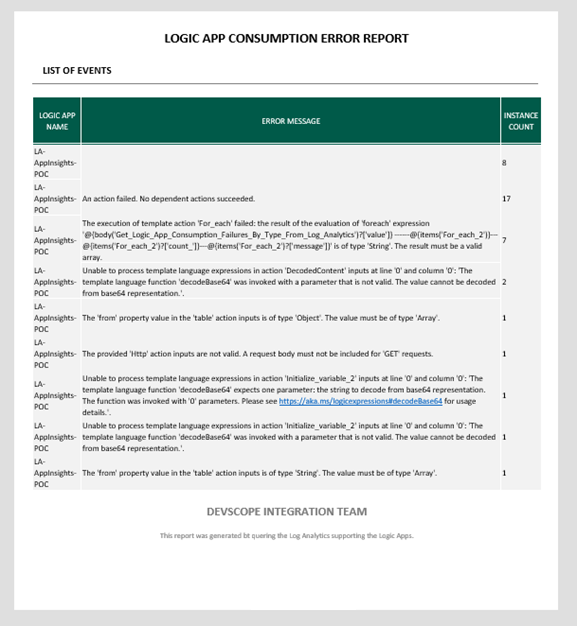
And to achieve this, what we have done is to use an already HTML-based document and an Azure Function to map the Rows into an HTML table. (We are not going to address this topic in this tutorial)
Finally, in our Logic App, we may want to validate whether the query returns results or is empty, and then send an email with the report.
- On the body of the email, add the Variable containing the HTML template (and the Azure Function call result), and add a subject and an email.
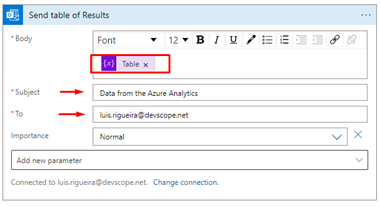
- Save the Logic App once it is finished.
And now you will get the report from Log Analytics Workspace!
Remember that, for example, if you set the recurrence as daily and the query also is looking for events that have occurred in the last 24 hours, you might not have an email to present since the condition prevents it from sending the email if the Body is null, but this also means there are no flaws in your logic apps, which is always nice!
Thanks to my team member, Luís Rigueira, for helping me realize and implement this idea.
Hope you find this useful! So, if you liked the content or found it useful and want to help me write more content, you can buy (or help buy) my son a Star Wars Lego!