
Some time ago I wrote a blog post on how to Process Feedback Evaluations (paper) automagically with SmartDocumentor OCR, Logic Apps, Azure Functions and Power BI, at that point there weren’t so many of the functionalities that we have at the moment both on Logic Apps and Microsoft Flow: like concept of variables, Case operations, more expressions an so on. I will not address here in this blog post whether we can redesign to be different or better. The question I raise and will address here is: can we do the same with Microsoft Flow, instead of using Logic Apps?
And the reason I ask this question is that Microsoft Flow is more targeted to Business Users, which fits perfectly with scenarios where we want to extend a product to meet each business user’s requirements/scenarios. If you have an Office 365, you can use Microsoft Flow, and you will have 2,000 runs per month, so you don’t need to pay extra for using Logic Apps; you can instead use Microsoft Flow.
And the answer is: Yes, you can!
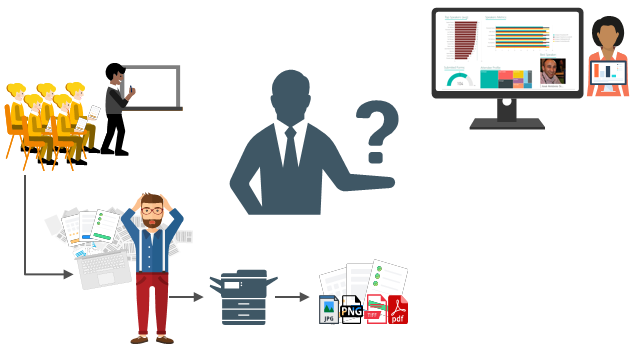
The problem and scenario will be exactly the same: How can we easily convert paper in data to generate additional value? How can we perform operations on it and easily gain insights?
📝 One-Minute Brief
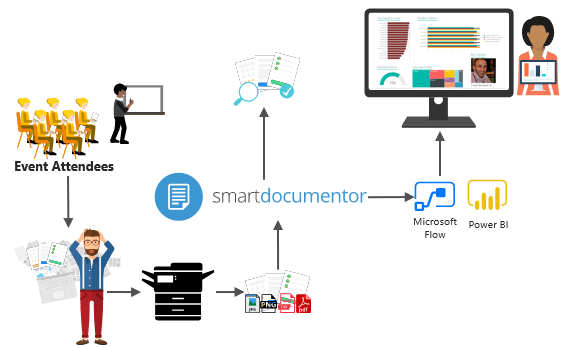
Learn how to bridge the gap between physical paper and digital insights. Sandro Pereira demonstrates a seamless automation workflow that uses SmartDocumentor Cloud (OCR) to extract data from paper feedback forms, Microsoft Flow (now Power Automate) to process the results, and Power BI to visualize the evaluation data in real-time.
But in this case, to solve this problem, in which I wanted to have the evaluation forms processed in real-time, i.e., as the attendees handed in the forms, the results were presented in a public Power BI dashboard in a matter of seconds, we will be using:
- DevScope SmartDocumentor OCR not only allowed me to extract the data from my documents and easily integrate with other systems, but also to intelligently set my OCR streams (flows), defining:
- Different receive locations, like FTP, file, or directly from scanner devices;
- Create/test my recognition templates and review/ validate the data that is gathered;
- But also enabled me to connect to and send metadata (XML or JSON) through any HTTP service; I could even extend it by using a PowerShell provider to execute a PowerShell script.
- Microsoft Flow allows all types of Business Users to create and automate workflows across multiple applications and services without developer help, in a simple and fast way. These automated workflows are called flows.
- And finally, Power BI to create interactive data visualization (dashboards and reports).
Processing Feedback Evaluations: The solution
SmartDocumentor: to process and extract metadata from paper
Again, I’m not going to explain in detail how the solution is implemented in DevScope’s SmartDocumentor, as that is not the point of this article. If you want to know more, you can always contact me. However, let me contextualize you:
- SmartDocumentor OCR flow will listen at two receive locations: the Share Folder and directly from the scanner device.
- After receiving and extracting the data from the scanned documents (paper), SmartDocumentor will send the metadata to a Microsoft HTTP endpoint.
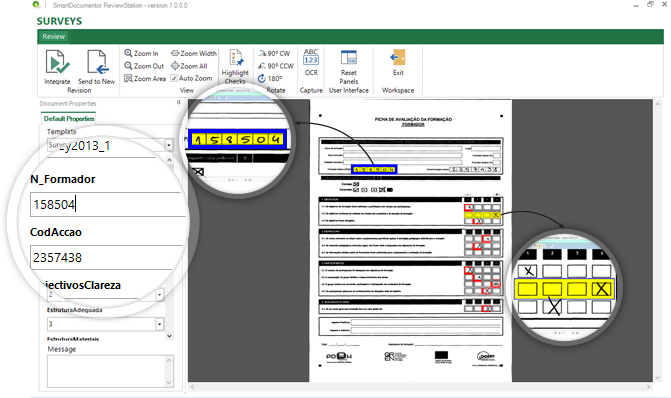
- Inside the SmartDocumentor processes, we can optionally specify if we want to review the documents – SmartDocumentor Review Station – before they are sent to the Microsoft Flow (or any other system).
Power BI to deliver interactive data visualization (dashboards and reports)
Regarding Power BI, the Microsoft Flow Power BI connector (which is the same as the Logic Apps connector) only allows you to use streaming datasets (this has advantages and some disadvantages that we will see further on), which lets you to easily build real-time dashboards by pushing data into the REST API endpoint. To create your streaming datasets, you should have access to Power BI with your account:
- Select your Workspace > Datasets, then in the top-right corner, click + Create and select Streaming dataset.
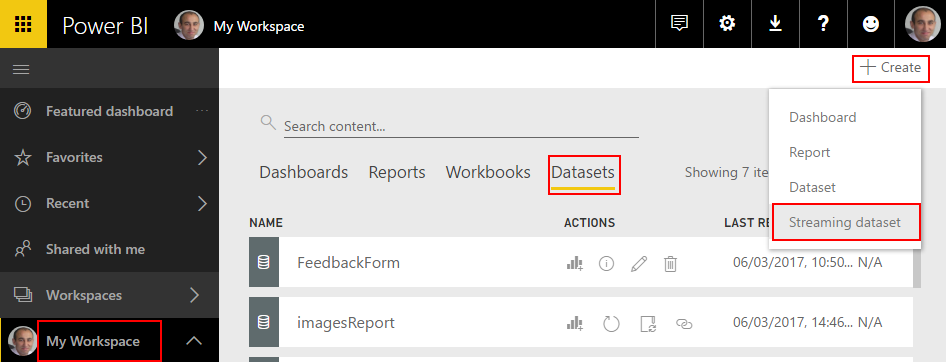
- In the New streaming dataset, select API and then click Next.
- In the second New streaming dataset, give a name to your dataset: FeedbackForm, and then add the following elements:
- SpeakerName (Text) – represents the name of the speaker that is obtained in the evaluation form according to the session.
- ContentMatureFB (Number) – a value between 1 and 9 that is obtained in the evaluation form
- GoodCommunicatorFB (Number) – a value between 1 and 9 that is obtained in the evaluation form.
- EnjoySessionFB (Number) – a value between 1 and 9 that is obtained in the evaluation form
- MetExpectationsFB (Number) – a value between 1 and 9 that is obtained in the evaluation form.
- SpeakerAvrg (Number) – A simple average calculation (sum all the above metrics divided by 4)
- WhoAmI (Text) – represents the type of attendee you are (developer, architect, …) that is obtained in the evaluation form.
- SpeakerPicture (Text) – picture of the speaker according to the session that is obtained in the evaluation form.
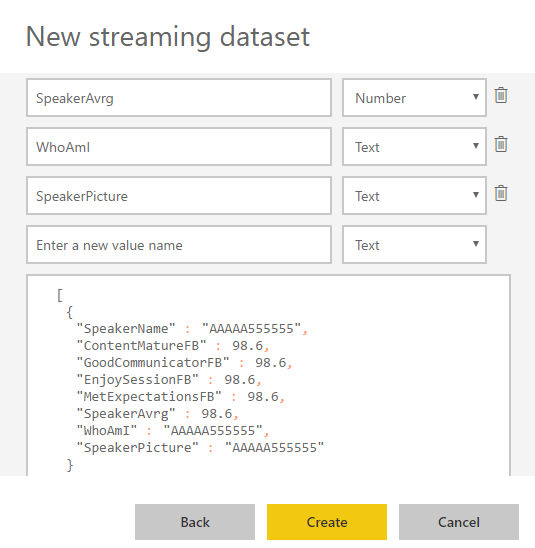
- And because we want to create interactive reports to gain more insights from the event. We need to enable Historic data analysis and then click Create.
Unfortunately, a streaming dataset is meant to be used for real-time streaming and is a little limited in terms of what we can do with it. For example, it doesn’t allow you to combine different sources, for example, a table that can correlate speakers to get their pictures, or to make aggregations of metrics like Speaker average. Which means that we need to send all of this information from Microsoft Flow.
Microsoft Flow to create an integration process flow
At the beginning of this article, I mentioned that one of the advantages of Microsoft Flow is that it allows Business Users to create and automate workflows across multiple applications and services without developer help. So, for this example, I will try to abstract from the fact that I am a developer and “try” to implement as if I were a business user: no custom code is allowed!
Microsoft Flow will be the component that allows us to extend a product (OCR software) that, like all products, is limited to certain features and capabilities, to be able to communicate with a wide range of SaaS applications that appear on the market every day.
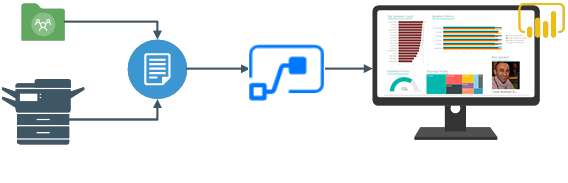
In order to integrate SmartDocumentor OCR with Power BI, we need to create a Microsoft Flow that:
- Accept JSON via an HTTP POST. For that, we use a Request > When a HTTP request is received trigger.

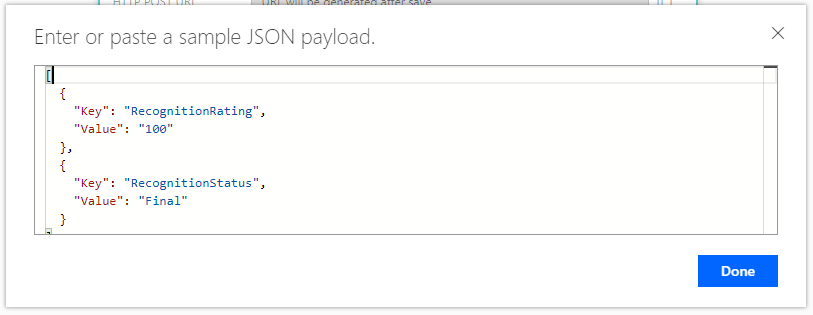
- And because we have friendly tokens to access the elements of the message, we will use a sample JSON message to be able to generate the correct JSON Schema. For that, you should:
- From the trigger configuration box, select the option Use sample payload to generate schema and paste the above sample:
[
  {
    "Key": "RecognitionRating",
    "Value": "100"
  },
  {
    "Key": "RecognitionStatus",
    "Value": "Final"
  }
]
- To generate the JSON schema, click Done.
- Next, we need to create the following support variables that we will use to store the data extracted from the SmartDocumentor JSON message – that is, a Name/value typed message – to be sent to the Power BI dataset:
| Name | Type | Initial Value |
| count | Integer | 0 |
| speakerName | String | |
| Picture | String | |
| ContentClear | String | |
| GoodCommunicator | String | |
| EnjoySession | String | |
| MetExpectation | String | |
| whoAmI | String |
- For that, we need to add a +New step and Add an action. Then enter Variables into the search box. Select Variables > Initialize variable from the actions list.
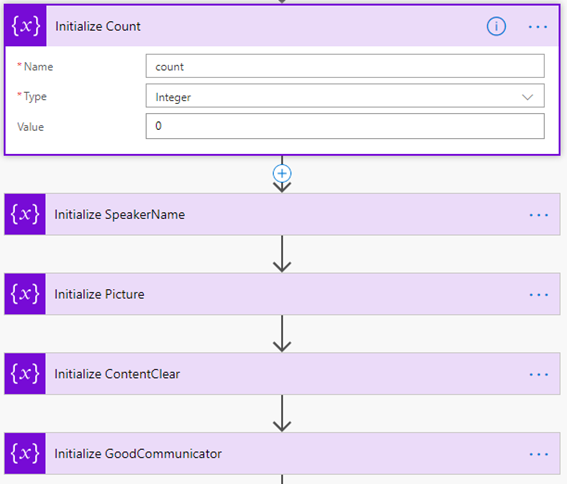
- And repeat the same task for all the variables.
Note: Unfortunately, to the date, there is still no way to create multiple variables using a single shape. In my opinion, this could and should be made as a table approach instead of the existing approach.
Now that we have all our variables that we need to store the information that we need to extract from the SmartDocumentor JSON message, we need to start extracting based on the Evaluation form. The first part of the form is: What session are you evaluating:
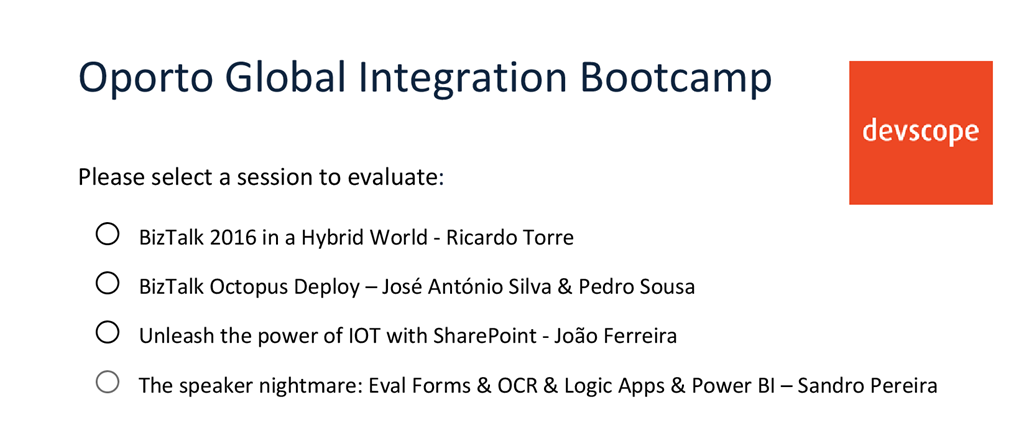
and for us to find out which session is selected, so we can “map” the speaker and picture name we need to look for the keys “S1”, “S2”, “S3”, and “S4”, and see which one is filled. To do that, we need to:
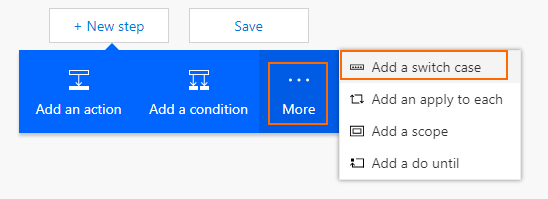
- Click in +New step, followed by … More and then select Add a switch case.
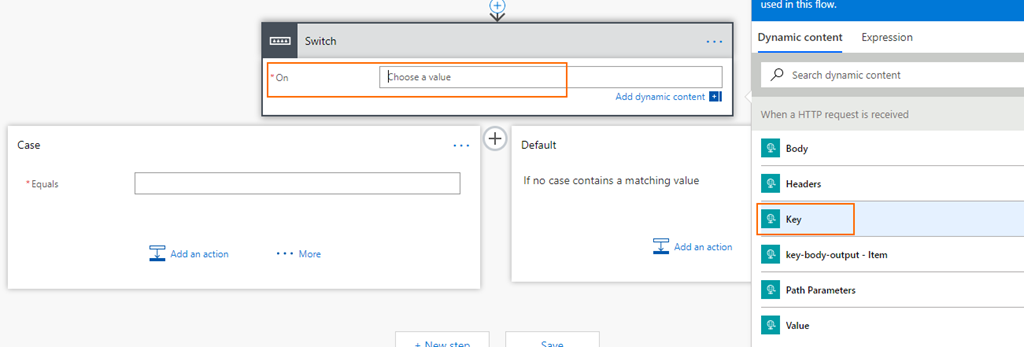
- On the On property of the switch condition configuration, select from the list of tokens the Key token from the When a HTTP request is received trigger.
- Because this is a Key/Value message with multiple records, the Flow designer automatically places this switch condition inside a Loop that iterates over each key/value pair.
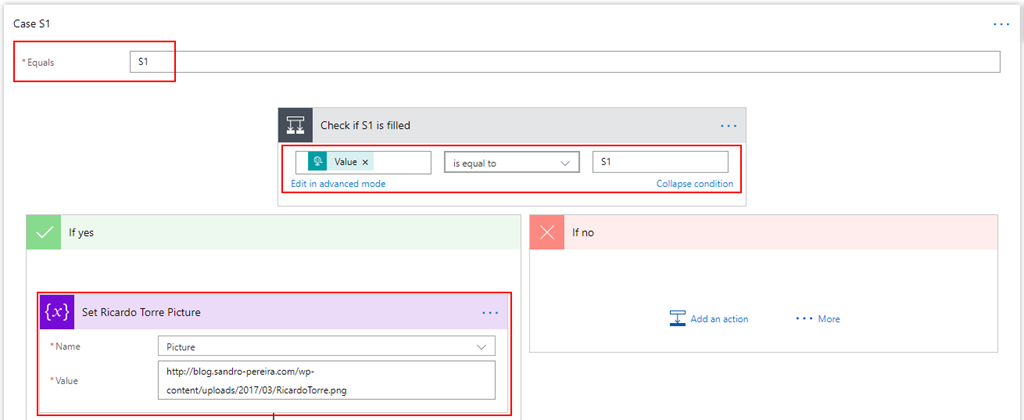
- Add 3 more new Case branches and repeat the same steps, this time configuring the values to look for “S2”, S3”, and “S4”.
The second part of the form is: How do you rate this session?
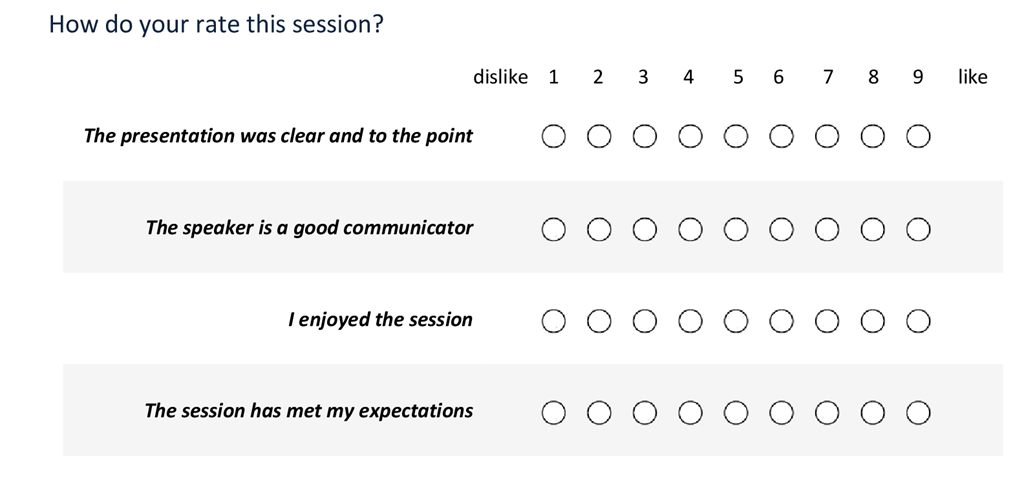
To extract this information, and because we already have a Switch case condition in place, what we need to do is:
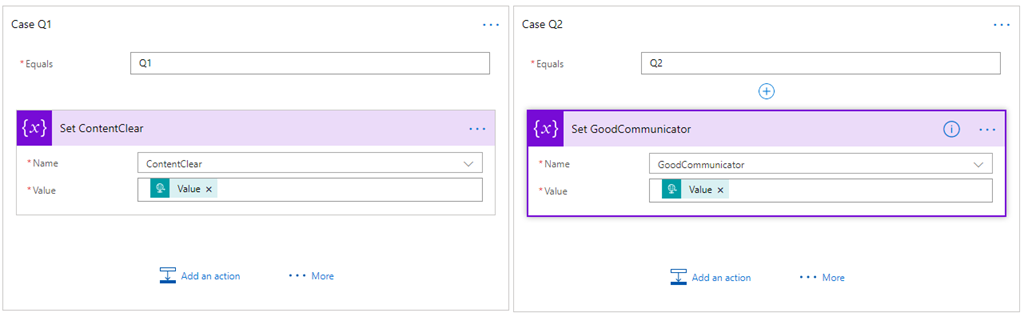
- Create 4 new different branches in the Switch case condition, one for each question – “Q1”, “Q2”, “Q3”, and “Q4” – and then:
- On the Equals property, type Q1.
- And then choose the Add an action option and on the Choose an action window, enter Variables and select the trigger Variables > Set variable.
- And set the ContentClear variable to the rate provided by selecting from the list of tokens the Value token from the When a HTTP request is received trigger.
- Do the same steps for
- “Q2” to set the variable GoodCommunicator.
- “Q3” to set the variable EnjoySession.
- “Q4” to set the variable MetExpectation.
Finally, the last section is about Who am I:
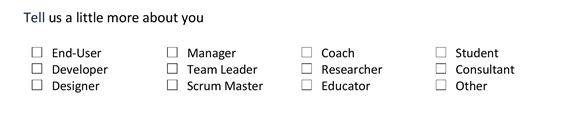
This is probably the most complicated section. Here, we want to travel through a range of positions, and if this is selected, we append to a string, separated by commas, something like “Developer; Student”. To do that, we need to:
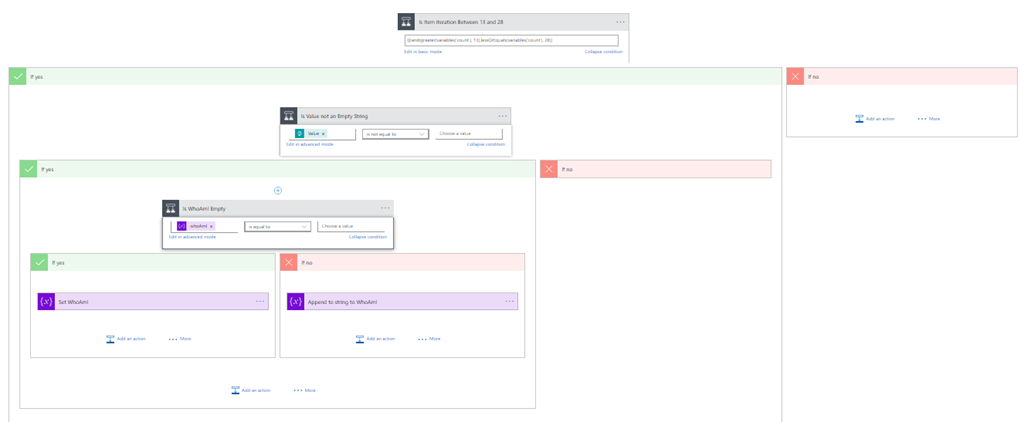
- On the Default branch, add a new condition by selecting … More, and then select Add a condition.
- In the condition expression, select “Edit in advanced mode” and then type the condition to treat the key/name pair if the count variable is >13 and less than or equal to 28:
@and(greater(variables('count'), 13),lessOrEquals(variables('count'), 28))
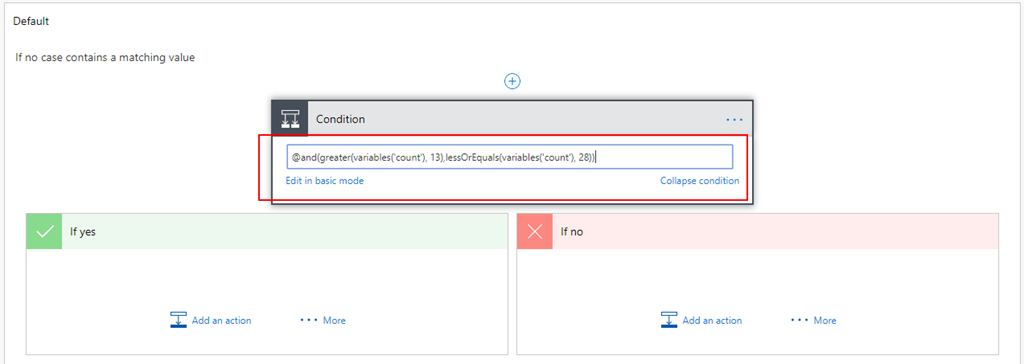
- On the Yes branch:
- We need to check if the tag is selected or not. If yes, we need to add to the whoAmI. Otherwise, we do nothing. To do that, we need an extra if condition: Add a new condition by selecting … More, and then select Add a condition.
- On the Choose a value property, select the Key token from the When a HTTP request is received trigger.
- On the condition set Is not equal to.
- And in the other Choose a value property, leave it empty.
- On the Choose a value property, select the Key token from the When a HTTP request is received trigger.
- We need to check if the tag is selected or not. If yes, we need to add to the whoAmI. Otherwise, we do nothing. To do that, we need an extra if condition: Add a new condition by selecting … More, and then select Add a condition.

- However, to properly set the whoAmI variable, we need an additional condition to check whether it is empty. If the whoAmI variable is empty, set it to the value a comma and the new value to the existing value. To do that, we need to:
- Add a new condition by selecting … More, and then select Add a condition.
- On the Choose a value property, select the whoAmI token from the Variable context.
- On the condition set Is not equal to.
- And in the other Choose a value property, leave it empty.
- On the Yes condition, choose the Add an action option, and in the Choose an action window, enter Variables and select the trigger Variables – Set variable.
- And set the whoAmI variable to the desired value – select the Key token from the When a HTTP request is received trigger.
- And on the No condition, choose the Add an action option, and in the Choose an action window, enter Variables and select the trigger Variables – append to string variable.
- And set the whoAmI variable to the desired value – select the Key token from the When a HTTP request is received trigger.
- Add a new condition by selecting … More, and then select Add a condition.
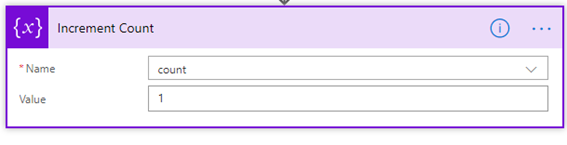
- Finally, after the Switch case condition, and just before finishing the Apply to each cycle.
- On the Choose an action window, enter Variables and select the trigger Variables – Increment variable.
- On the Name property, select the count variable.
- And on the Value set as 1.
- On the Choose an action window, enter Variables and select the trigger Variables – Increment variable.
To finalize the entire process, we just need to:
- Calculate the rate average – the sum of all question results divided by the number of questions.
- And send it to Power BI.
To accomplish that, we need to:
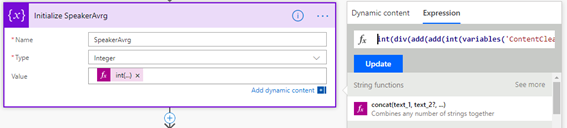
- Click on +New step, followed by Add an action, and then enter Variables into the search box. Select the trigger Variables – Initialize variable.
- On the Name property, select the SpeakerAvrg variable.
- On the type property set to be an Integer.
- And in the Value property, from the context dialogue box, select the Expression tab and set the following expression:
int(div(add(add(int(variables('ContentClear')), int(variables('GoodCommunicator'))) , add(int(variables('EnjoySession')), int(variables('MetExpectation')))),4))
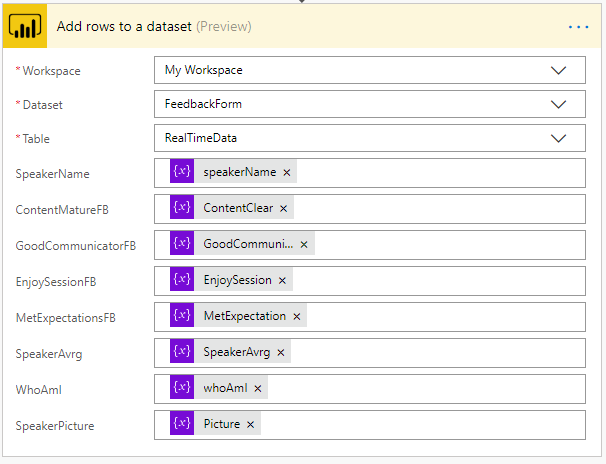
- In the last step of the Flow, we push the data into the Power BI streaming dataset created earlier by using the new Power BI Connector. To do this, we need to:
- Click on +New step, followed by Add an action, and then enter Power BI into the search box. Select Add row to streaming dataset from the actions list.
- Select the name of the workspace and then the name of the streaming dataset
- The next step is to select the Table titled RealTimeData.
- And finally, map the properties with the different variable tokens has in the picture.
- Click on +New step, followed by Add an action, and then enter Power BI into the search box. Select Add row to streaming dataset from the actions list.
Give a proper name to the flow and save it
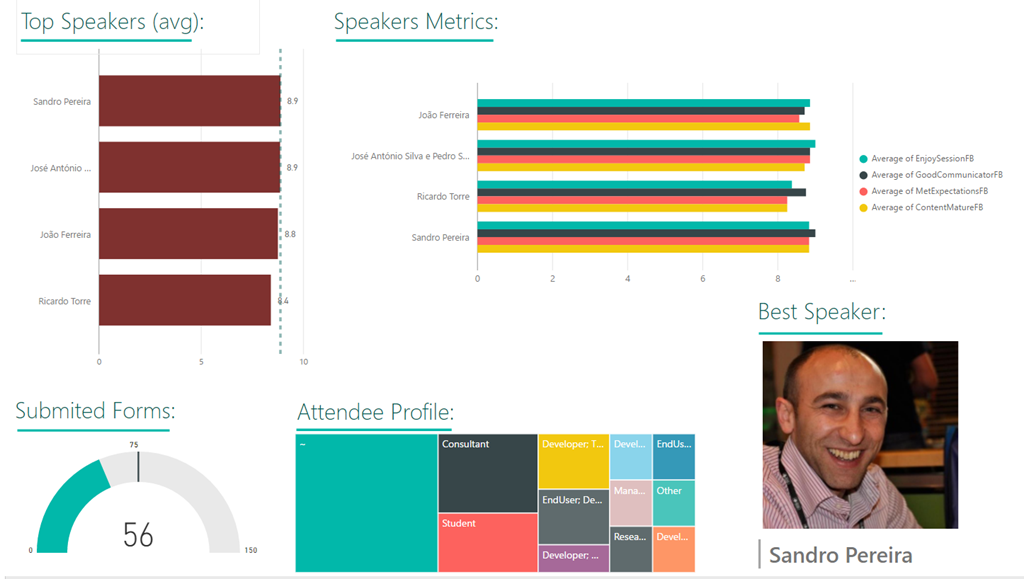
The end result
After saving the Microsoft Flow and processing the Evaluation forms, the result is this beautiful and interactive report that we can present on a monitor during the breaks of our events:
Hope you find this helpful! If you liked the content or found it useful and would like to support me in writing more, consider buying (or helping to buy) a Star Wars Lego set for my son.

1 thought on “Processing Feedback Evaluations (paper) automagically with SmartDocumentor OCR, Microsoft Flow & Power BI”