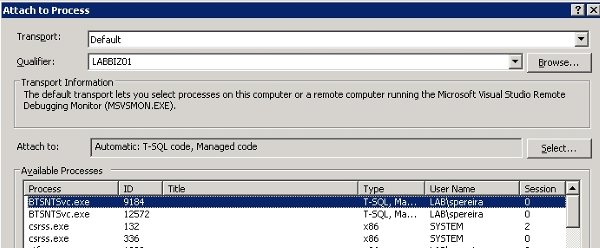
We can debug, for example, external assembly’s that are called from within a BizTalk process or debugging pipeline components in run-time mode. In Visual Studio set breakpoints in your code. To debug you must attach to the BizTalk process that is running the .NET code.
- Click on the Debug menu in Visual Studio and select the Process menu item.
- When the Available Processes dialog opens find and select the BTSNTSvc.exe process.
- Click on the Attach button.
Problem
If we have more than one host instance configured when we open the debug menu and choose to attach to the process, it appears all host instances with the same process name (“BTSNTSvc.exe”), like this:
Determining which process to attach to
Now, you need to choose the right BTSNTSvc.exe process by determining the process ID.
You can do this in two ways:
- You can use the TASKLIST command to query the processes. Execute the following command in a command prompt on the remote box:
TASKLIST /FI “USERNAME ne NT AUTHORITYSYSTEM” /FI “IMAGENAME eq BTSNTSvc.exe” /SVC
- Or you can use this application (EnumerateBiztalkProcesses), which shows you the memory consumption and process ID of all running BizTalk hosts
Hope you find this helpful! So, if you liked the content or found it useful and want to help me write more, you can help us buy a Star Wars Lego for my son!


How do you debug a pipeline component running on WCF-CustomIsolated host on IIS7 on a Win 2008 64bit env? What is process name to attach on VS debugger?
Hi Ritesh,
You need to attach to “BTSNTSvc.exe” process, if you have more than one and you don´t know which to choose, select all “BTSNTSvc.exe” process’s
Another way to debug pipelines is using pipeline.exe utility:
– http://sandroaspbiztalkblog.wordpress.com/2010/04/08/debug-biztalk-custom-pipelines-components-using-pipeline-exe-utility-pipeline-file-name-is-already-specified-error/
I got the answer from MSDN forum http://social.msdn.microsoft.com/Forums/en-US/biztalkgeneral/thread/81243a96-9d2e-464b-8b81-90e35e415b6d/
Attaching BTSNTSvc.exe did not work, you need to attach w3wp.exe. And w3wp.exe will not show up in list of processes unless you browse the URL from IE. I coudn’t use pipeline.exe tool as I am getting problem only while receive calls from Java based client. So, had to debug at runtime. Anyway, thanks a lot for taking time and replying.
Hi Ritesh,
It´s always a pleasure to try to help, sometimes you learn some things, and this is one of these cases :), thanks for letting me know the solution.
Thanks for the tip – I was also having another pipeline debugging problem that I thought I may share the results of:
One issue that I ran into was that even when I attached to the correct process (I used sysinternals procexp.exe; not as clean as TASKLIST, but offers much more info, and I tend to gravitate to information overload) I kept getting the following warning upon attaching and no breakpoints were hit:
“Breakpoint will not currently be hit. No symbols loaded for this document.”
My build output target (which I had set to the Pipeline Components folder) had the .dll and corresponding .pdb (“symbols”) file, but apparently it was pulling the code from the GAC (it had previously been GAC’ed) instead of my output folder (check the Modules window during debugging to see where the .dll is loaded from).
Of course pipeline components don’t usually need to be GAC’ed, but if it had previously been GAC’ed then you can either 1) un-GAC and load from Pipeline Components and make sure you also have the matching .pdb file or 2) add the matching .pdb file into the GAC
Just something to look out for.
Hi Will,
Great tip and thanks for shared here.